
Nestled at the base of the Rocky Mountains, Boulder Valley School District (BVSD) encompasses a large geographic area of 500 square miles, and includes at its center the city of Boulder, which has grown from a frontier town to a hip college town. The surrounding communities of Louisville, Lafayette, Erie, Superior, Broomfield, and Nederland add a mix of small-town charm, suburban neighborhoods, and rural mountain living to the diversity within the district. Home to many technology companies and now one of the most affluent communities in the state, BVSD is a high-performing district with an 89.7% graduation rate and a high percentage of students scoring proficient on the state standardized tests. But as in virtually all districts, there is variation in performance among schools and among student segments, and BVSD is continually striving to do better and do more for its students.

After hearing about District Management Group’s (DMGroup’s) data-driven approach to measuring academic return on investment (A-ROI), Chief Financial Officer Bill Sutter, a board member of the Association of School Business Officials International (ASBO), was eager to learn more. He decided to have his team participate in DMGroup’s SY2017-2018 A-ROI Institute, a year-long training program on utilizing A-ROI to evaluate district programming; this DMGroup program was organized in partnership with the Government Finance Officers’ Association (GFOA), a nonprofit professional association for business officers based in Chicago.
After some months of exposure to the work, Sutter and Assistant Superintendent of Instruction Services and Equity Sam Messier were eager to apply the ideas learned in the A-ROI Institute across the district. With a new superintendent — Rob Anderson — arriving in July 2018, Sutter and Messier believed it was an opportune time to bring a data-driven lens to district programming. This could help Anderson and the district in driving their new strategic direction.
DMGroup proposed that the district start by taking stock of all the programs initiated by the central office. Given the geographic expanse and the differing characteristics of its schools, the district promoted school autonomy. But despite this decentralized approach, the central office has long prided itself on providing strong support and fostering innovation among its 56 schools, and was constantly introducing new programs and initiatives for schools to consider. As in many districts across the nation, initiatives had been layered on top of one another over the years. But given the geographic expanse and decentralized approach, it had become difficult for the central office to keep track of which initiatives had been adopted, whether they had been implemented with fidelity, which were still in place, and how successful each had been.
And like many districts, BVSD found it politically challenging to sunset programs, because virtually every program had a constituency that would advocate to keep it.
The district decided to engage DMGroup to help take stock of all district initiatives and to help set the foundation for using the A-ROI approach — creating what DMGroup refers to as an “Initiative Inventory.” When the new superintendent Rob Anderson arrived, he viewed the A-ROI approach as central to helping the district create the focus he believed was needed to ensure that resources were being deployed equitably and most effectively for the district’s students.
After going through this process and seeing the powerful insights this effort yielded, the district has decided to redesign the process for setting central office budgets. The new process places A-ROI concepts at the center of decision making so that resource allocation is data-driven and aligned to support the new strategic plan that launched in the fall of 2019.

Initiative Inventory Work Begins
With a steering committee made up of BVSD district leaders, DMGroup launched the work to create a comprehensive list of district programs, focusing first on programs initiated by the central office. The BVSD steering committee sought to engage staff across all levels of the district in this work. The BVSD central office is segmented into nine departments — Operations, Information, Communications, Elementary School Leadership, Secondary School Leadership, Human Resources, Instructional Leadership and Equity, Student Assessment/Program Evaluation, and Special Education — and each of these departments has anywhere from two to ten subteams. DMGroup worked with each subteam to create its own initiative inventory spreadsheet, then rolled these up to department-level initiative inventory spreadsheets, and then to a consolidated spreadsheet. Engaging so much of the organization in the work was crucial to catalogue initiatives across 56 schools, but most importantly, it built understanding of the process at various levels of the district.
In total, 251 initiatives from 28 teams across 9 departments totaling over $46 million in ongoing costs were identified. Working with the district teams, DMGroup sought to capture in these initiative inventory spreadsheets extensive and detailed information and data about each initiative, which included:
• Vision/objective/rationale for the program
• Metrics for success
• Students served, including segment data
• Student outcome data
• Cost: fully-loaded costs, including allocation of staff time
• Connection to other efforts
• Alignment to existing strategic plan
Gathering all the necessary data was not an easy task. As in virtually all districts that have not been using the A-ROI approach, the desired data was not available for all initiatives.
BVSD found that some programs did not have clearly defined objectives or success metrics, and there were many instances where outcomes data was not collected or readily available. Identifying these gaps in data allowed BVSD leadership to consider where and how they might invest in additional data collection. In fact, one of the benefits of the initiative inventory process is that it shows where more investment is needed to gather the necessary information.
Getting at Fully Loaded Costs: An Unfamiliar Challenge
In every district, the largest investment is in staff salaries and benefits. Therefore, when considering the fully loaded cost of an initiative, a district must capture not only the direct costs such as the cost of purchasing curriculum, but also the cost of all staff time devoted to the program. As in virtually all districts, measuring the amount of time each staff member spent on each initiative was not a familiar task at BVSD.
The DMGroup team worked closely with BVSD staff to develop a method for coming up with the full cost of staff time for each initiative (Exhibit 1). First, DMGroup supported BVSD team leaders in brainstorming the staff time invested in programs, and then BVSD department leaders engaged their subteams to estimate the investment of staff time in more detail. DMGroup trained team leaders first to consider their own time investment, and then to walk their staff through this process. Team leaders recognized that this approach would help them gain a deeper understanding of where their staff’s time was invested and help them account for the value of staff time.
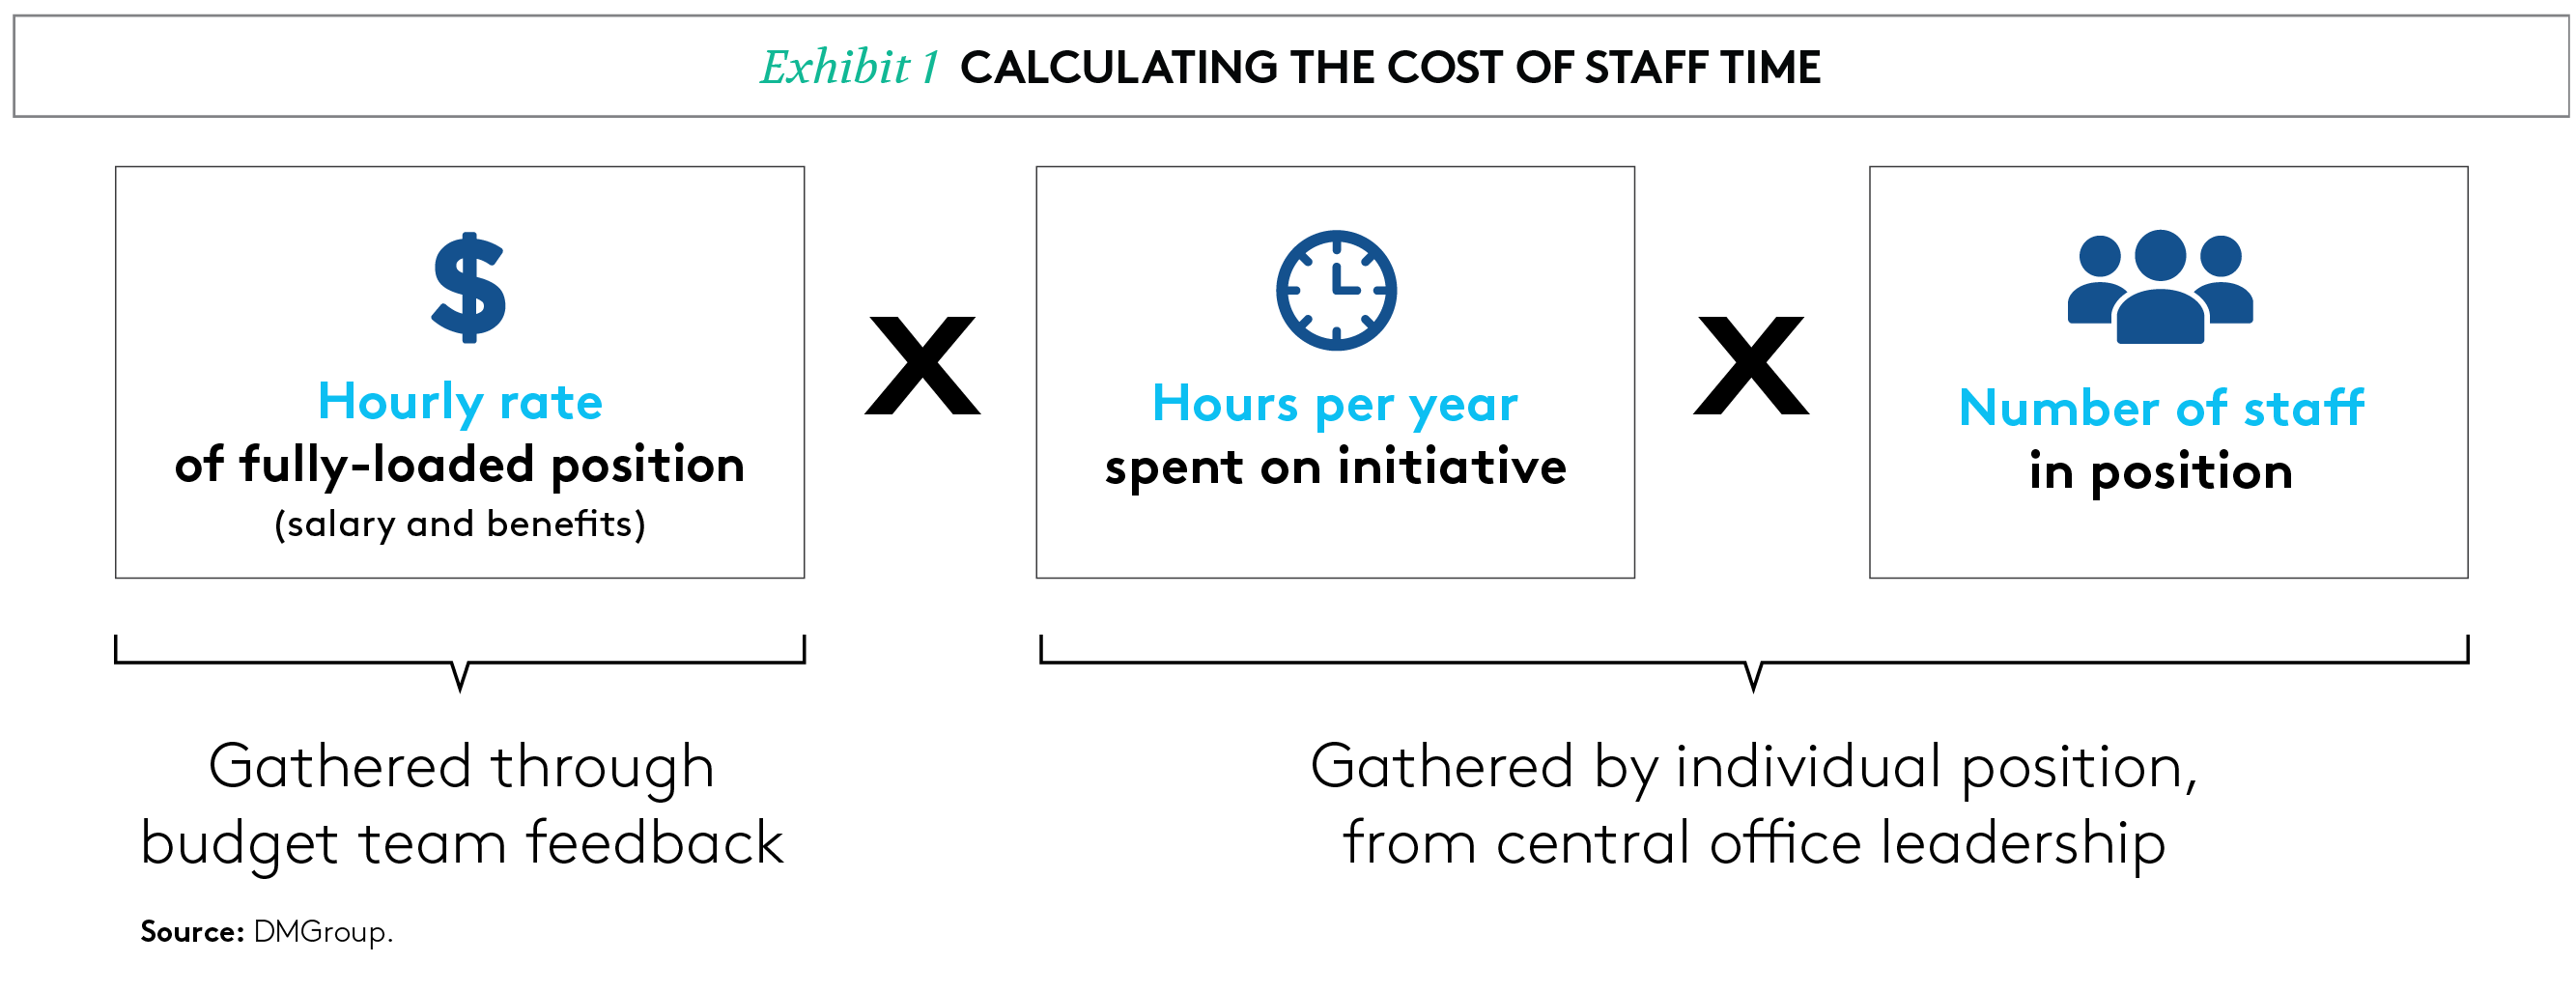
This cost calculation is both science and art, built on estimates of the amount of time being spent and by whom. The underlying assumptions and rules for making these estimates have to be applied with consistency and rigor across the board. If the methodology is consistently applied, it should allow for fair comparisons between programs.
Capturing the Intangibles
The value or return of any given initiative cannot be entirely captured in a single number. In education, with student success at the heart of the work, there are many intangible goals beyond test scores that can be captured only through qualitative data. Given the high level of school autonomy, the BVSD central office recognized how important it would be to collect high-quality, accurate information from principals. DMGroup therefore partnered with a key group of principal leaders to develop a user-friendly, time-efficient survey to capture principal input about programs in place across schools, with a focus on those initiated at the district level. The group of principal leaders tested survey prototypes and provided DMGroup with feedback on the usability of each model. Engaging principals in its development helped ensure an effective survey and had the added benefit of allaying potential confusion or apprehension about the work being done.
The detailed survey was then sent to principals to glean the following information:
• Their perceived value of each of the various programs
• Implementation status — if the programs were happening in schools
• The level of satisfaction with the program
• Which school-initiated programs were being used
• Whether additional support was needed for implementation
• If there were district programs they wanted but didn’t have
Principals were generally excited to participate in the initiative inventory process and appreciated the opportunity to share their perspectives on programs that worked well or needed improvement at their schools. The survey did not seek to capture why programs did not work well; instead, it was designed to capture preliminary information that would point to where more analysis might be warranted. Central office understood that there may be good programs that were perceived as not working well for a variety of reasons — poor implementation, poor professional development, poor leadership, etc. — and more analysis or modification of such programs might be warranted.
The survey also gave principals the opportunity to note additional school-initiated programs and to give brief descriptions of the goal of each program; this gave BVSD leadership the opportunity to see how schools were supplementing existing district-initiated programs with school-based resources. Finally, the survey asked principals if there were other programs that they wished they had access to; this provided valuable feedback for the central office in determining which programs to expand to meet the needs of schools.
Analyzing the Data
DMGroup worked closely with the central office to gather the necessary inputs, and then developed a detailed model that provided information on all assumptions, available inputs, and calculations for each initiative. As previously stated, not all desired information was available; outcomes data was particularly challenging to obtain. The process, however, was helpful in identifying gaps in information and will inform decisions about where to make investments in data collection. All the quantitative information that was available or could be approximated was gathered; the qualitative data was collected and analyzed; and finally, all information was consolidated.
The 251 programs in the inventory totaled $46.4 million in known ongoing costs, representing approximately 13% of total general operating costs. The spreadsheet covered the following categories and was filled in to the extent data was available:
• Initiative title
• Department that initiated it
• Description of the program
• Strategic priority that it aligns with
• Objective
• Campuses where it is implemented
• Target student population
• Student population served
• Success metrics
• Data source
• Outcomes data
• Start-up costs (non-personnel)
• Ongoing project costs (non-personnel)
• Personnel costs (calculated based on estimates of time allocated)
• Funding sources where applicable
• Start and end dates
• Principals’ perceptions of what works well and what does not
• Link to other initiatives
Insights
The data gathered from 251 programs proved sufficient to glean some important high-level insights. Although many programs did not have complete data available, DMGroup helped BVSD staff estimate costs and used principal feedback as a preliminary measure of program effectiveness. DMGroup analyzed the results, and some of the key insights are outlined here.
Percentage of Schools Implementing Each Initiative and Perception of Success
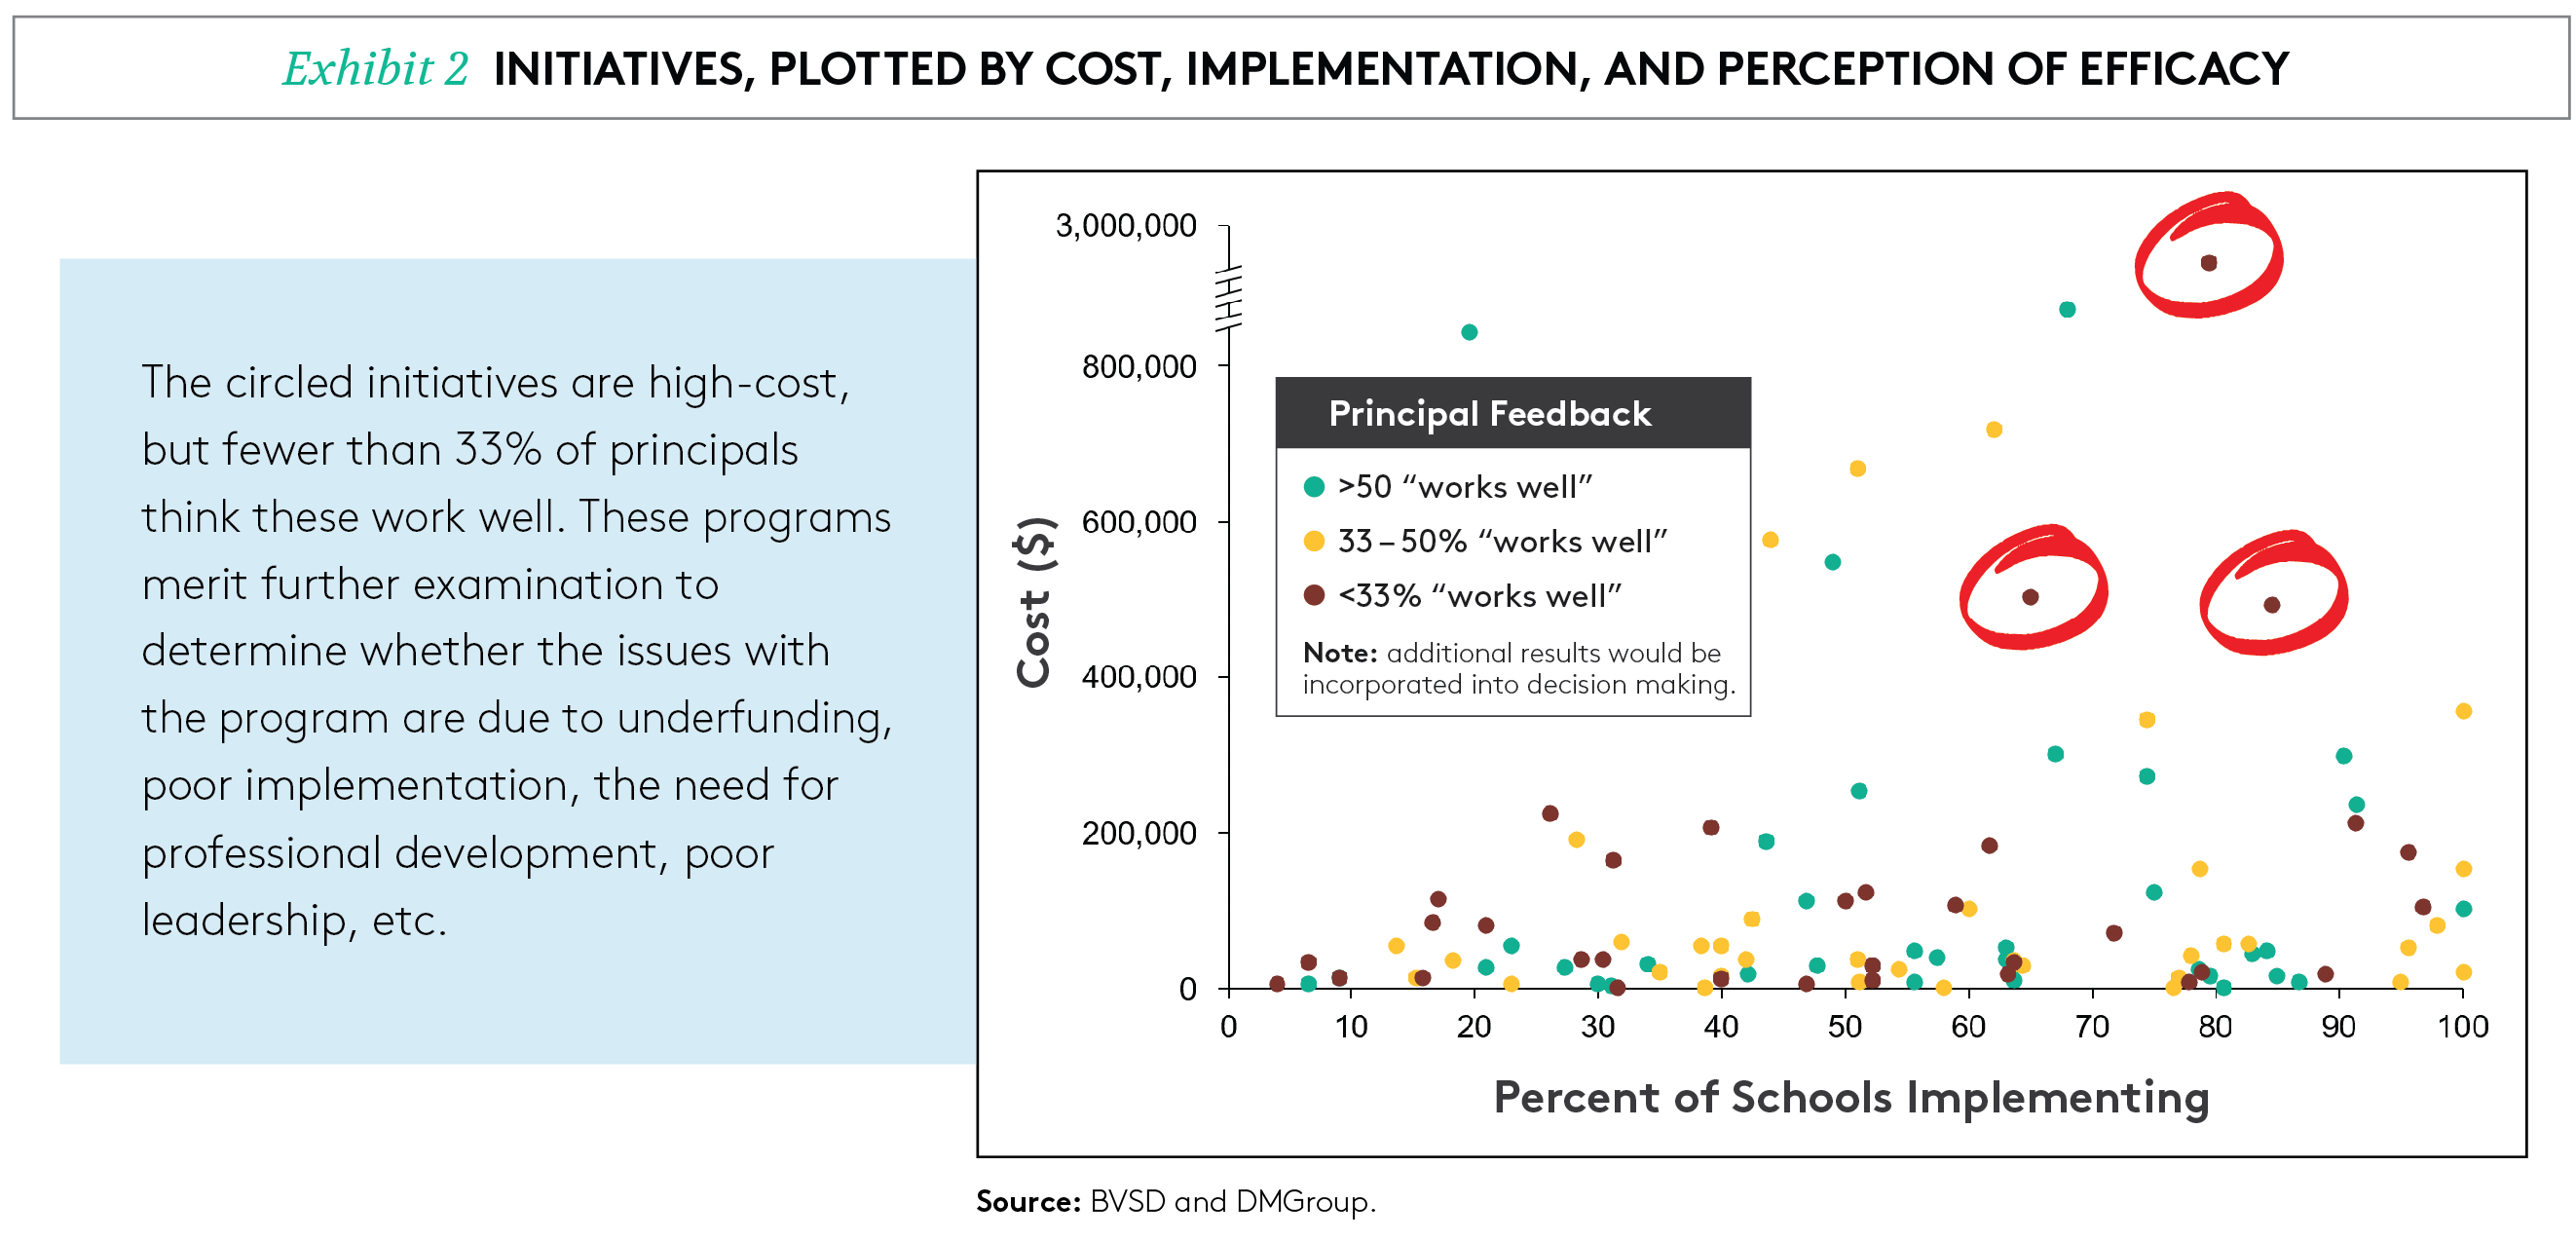
One analysis, illustrated in Exhibit 2, shows perceptions of outcomes (information garnered from the principal survey) relative to cost and breadth of implementation. The BVSD central office found this graph and other summary charts very helpful in gleaning what works and where changes might be considered.
For example, the red dots represent programs that relatively few principals thought “worked well.” By contrast the more prevalent green dots represent programs that the majority of principals thought did “work well,” and many of these are relatively low-cost initiatives. District leaders used this information to begin discussions of the future of the programs, considering how to improve or eliminate “red dot” programs and which “green dot” programs to keep or scale up. Everyone reviewing this information understood that there may be good programs that were perceived as not working well for a variety of reasons — poor implementation, poor professional development, poor leadership, etc. — and thus more analysis or modification of programs might be warranted; but it was generally acknowledged that this analysis provided insightful preliminary information.
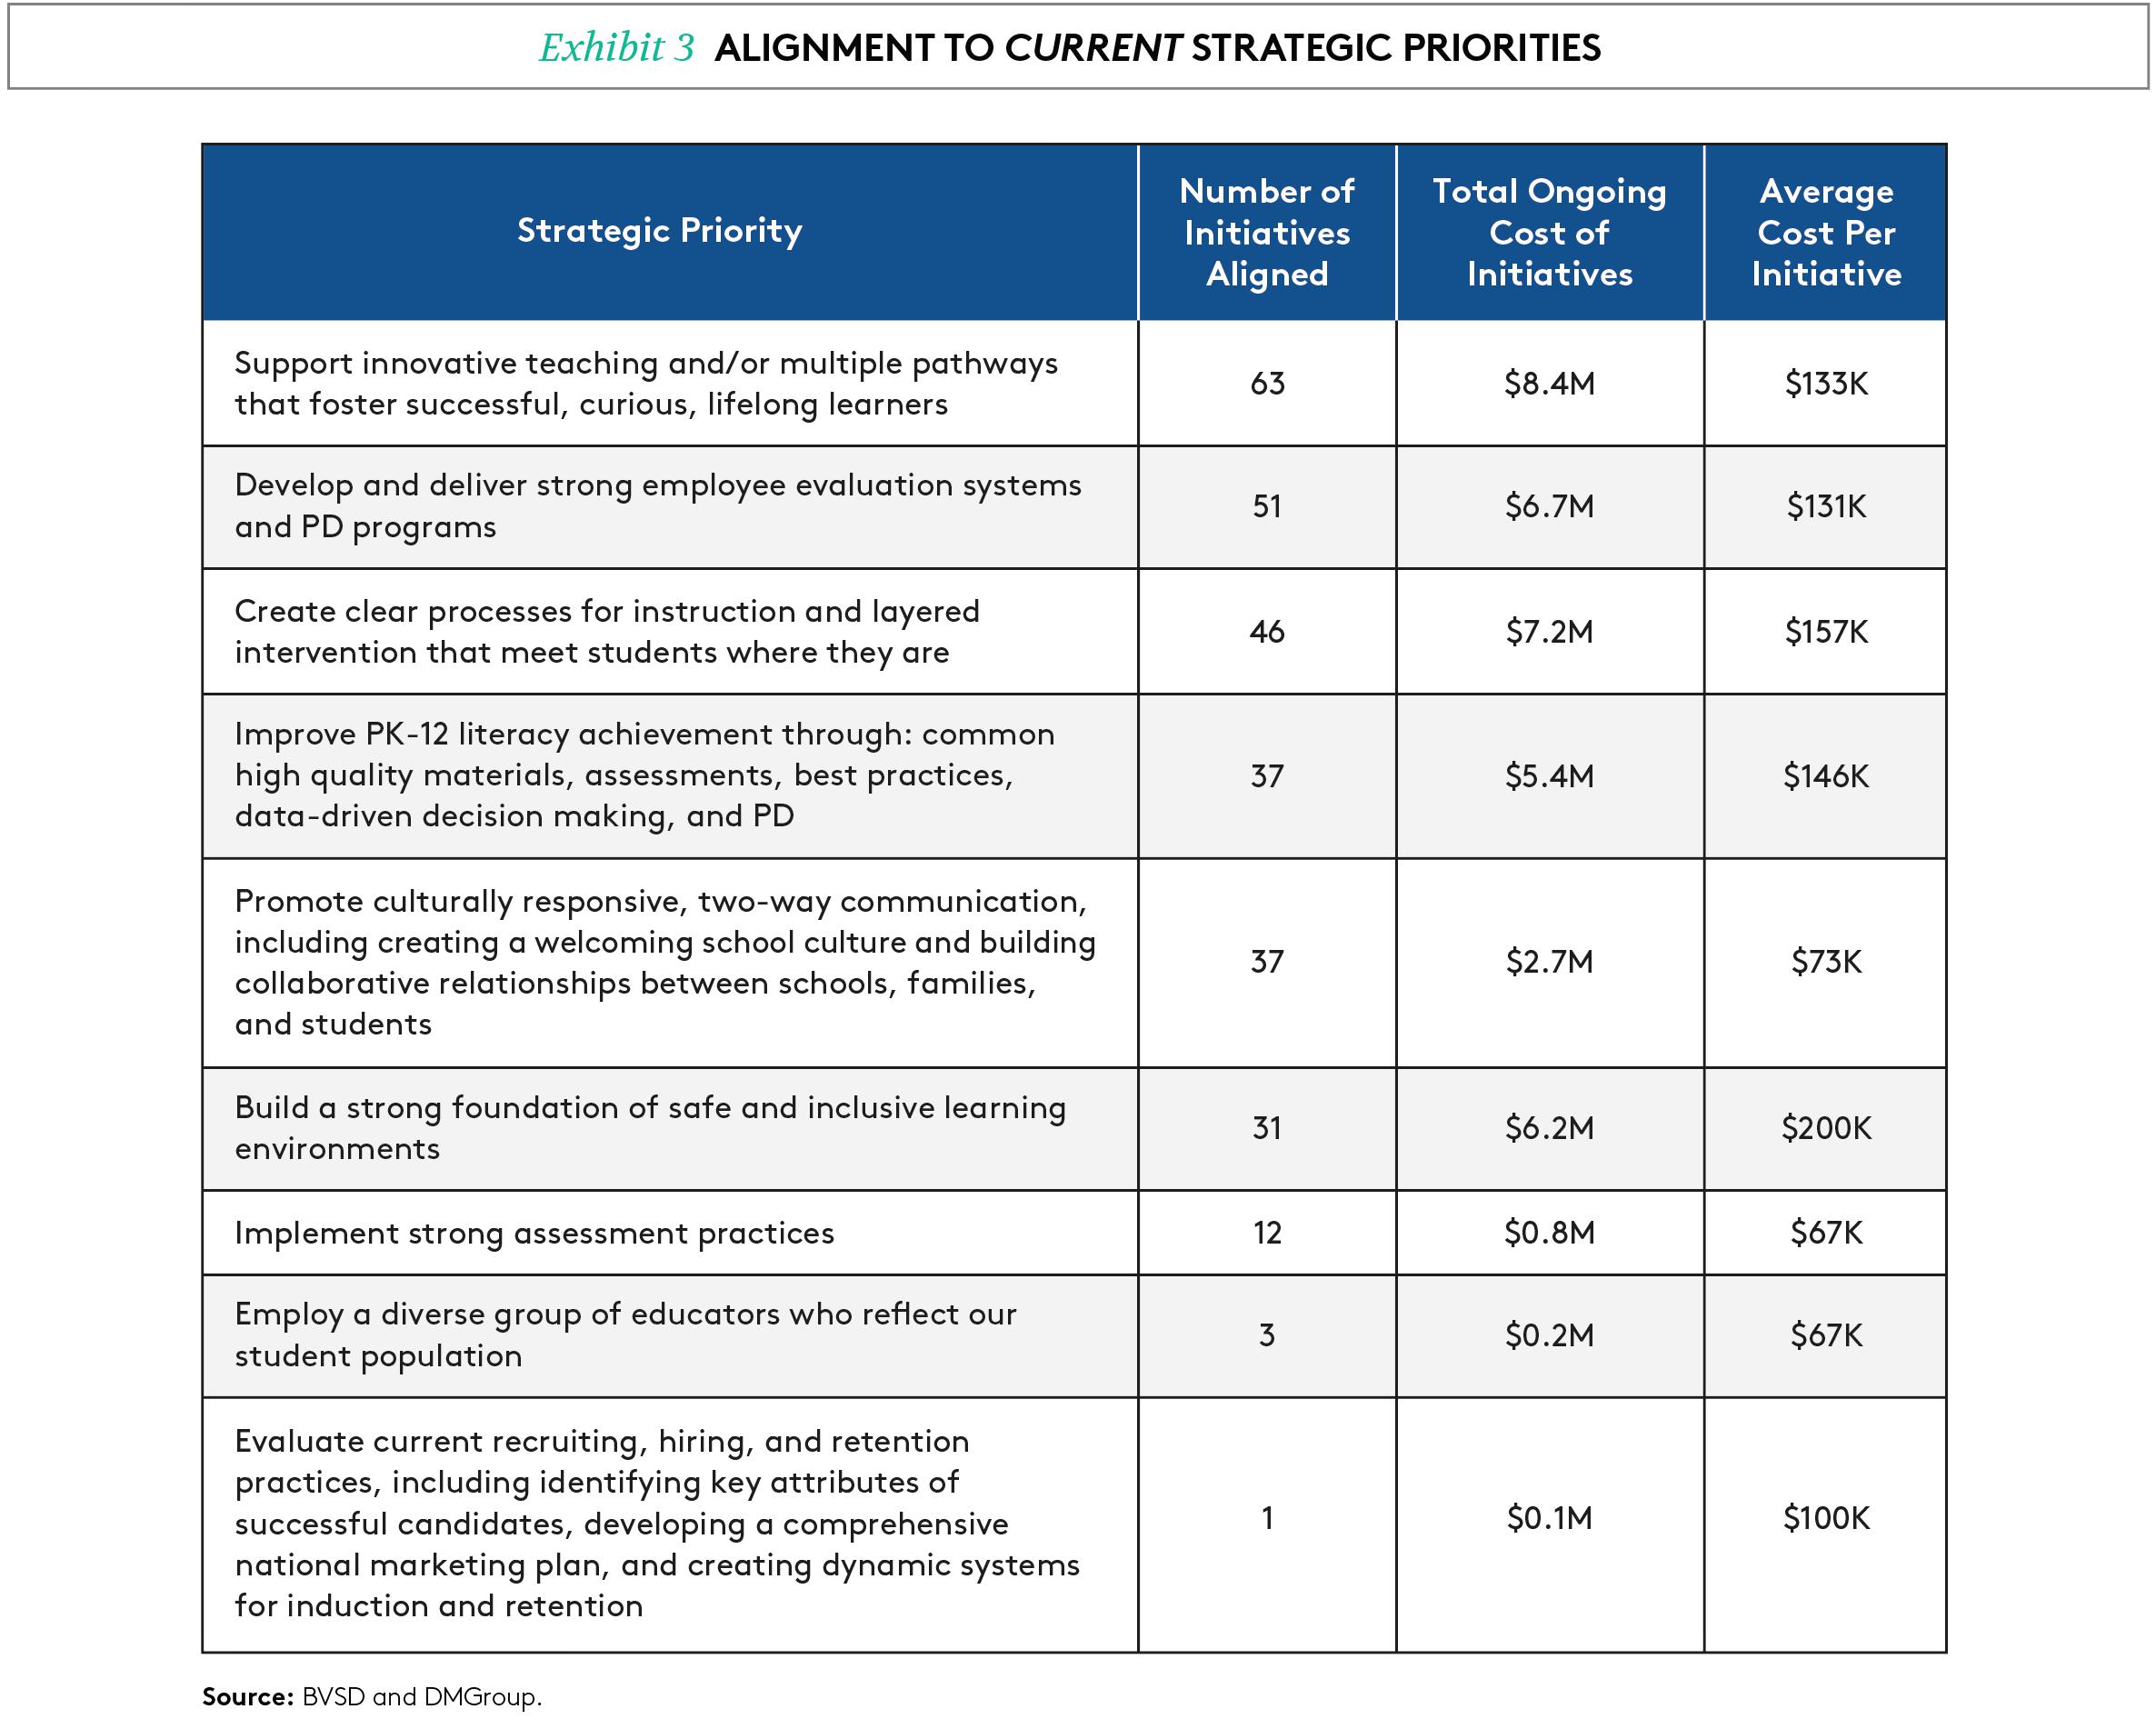
Alignment of Initiatives to District Priorities
In addition to analyzing each initiative, DMGroup mapped the initiatives to the district’s existing strategic priorities (Exhibit 3). This revealed how well programs aligned to the district’s current stated priorities: it showed the areas in which initiatives might be streamlined, and where additional investment might be considered. One of the strategic priorities — evaluating the district’s recruiting, hiring, and retention practices — had few initiatives, possibly reflecting the fact that the district was already successfully retaining teachers. With a new strategic plan rolling out in Fall 2019, this information helped district leaders assess where to focus investments in support of priorities.
Allocation of Resources by Specific Populations
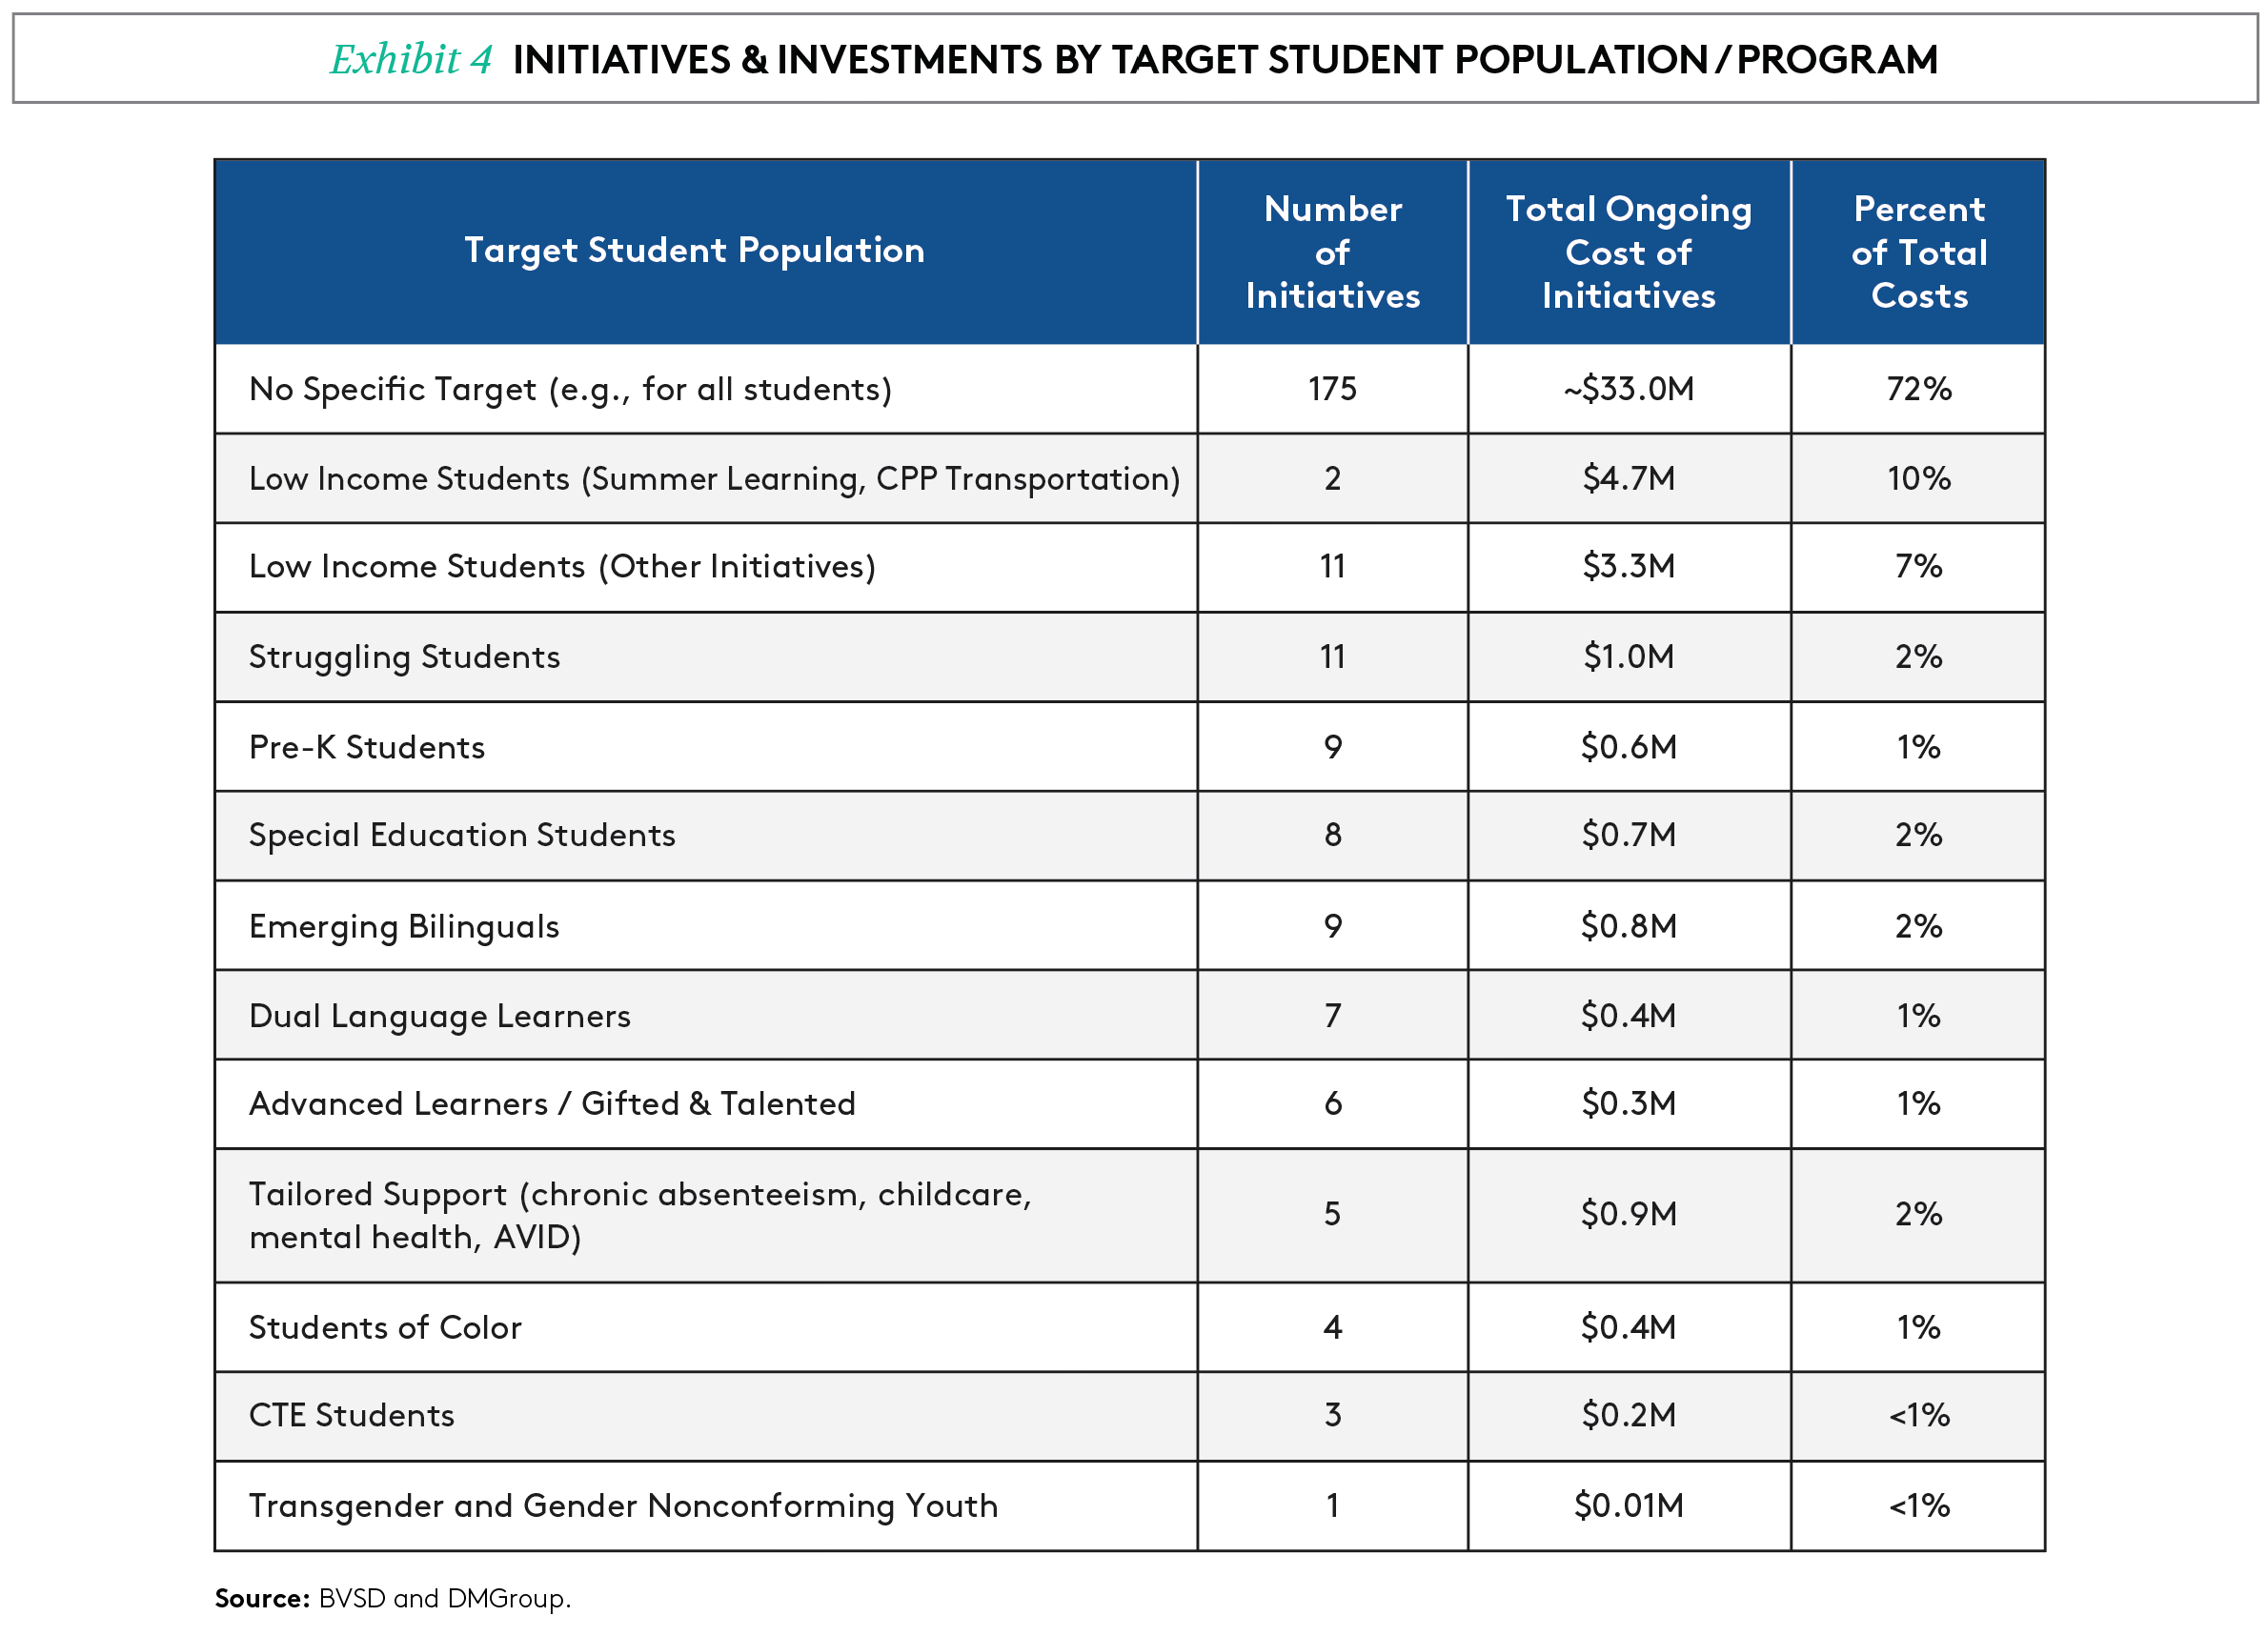
Another analysis showed that approximately 10% of the ongoing costs spent on initiatives are invested in efforts targeted to specific populations, with the remaining 90% of costs going toward programs that support the entire student population (it should be noted that this, however, does not reflect the higher staff allocation at some schools to meet the needs of specific student populations). The district is now reviewing strategies to target investments toward higher need students and specific programs (Exhibit 4) to ensure greater equity for all students.
Next Steps: Taking the Work to the Next Level
This initiative inventory was challenging work but was largely completed by January 2019 — within six months. It established how many programs the district operates, provided an initial indication of how effective the programs are, how they align with the strategic plan, which students benefit, and at what cost.
The insights garnered from the initiative inventory inspired Superintendent Anderson and his team to expand their use of cost and outcomes data to ensure that the district is being strategic and efficient in their deployment of resources. They are interested in expanding their application of A-ROI concepts and want to adjust their budget process to incorporate more data-driven decision making. The district has therefore decided to embark on a second phase of work in partnership with DMGroup to help to shape a new approach to budgeting for the future. By redesigning their budget process, they hope to ensure that resource decisions support three goals:
1. Strategy: The district has developed a new strategic plan since Superintendent Anderson’s arrival, and wants to ensure that resource decisions support the priorities of the strategic plan and help the district reach its goals.
The mapping of initiatives to strategic objectives during the initiative inventory provided important insights and underscored the importance of allocating resources to support strategic objectives. Resource allocation cannot remain fixed if different results are desired.
2. Efficiency: The insight provided by the initiative inventory has inspired the district to apply A-ROI concepts more broadly to determine which programs are working most successfully and most cost-effectively so that resources can be deployed efficiently. The district wants to be intentional about reviewing programs and sunsetting those that are less effective or poorly aligned with the district’s strategic plan.
3. Equity: The district wants to increase equity in the provision of resources to schools and departments. Because the initiative inventory showed that most existing programs are targeted toward the entire student population, the district is now considering where more focused support is needed for students with greater need or disadvantages.
To design a budget process in support of these goals, the district along with DMGroup began a full review of the current budget and school allocations to fully understand the current situation. The district’s finance team and DMGroup then mapped out a new budget process for SY2020-2021 that is more transparent, with spending decisions guided by A-ROI concepts. Implementing a new budget process will involve building a shared understanding of the current budget, building a full inventory of all initiatives taking place throughout the district, realigning resources based on a review of the existing budget and the objectives of the new strategic plan, and embedding A-ROI thinking and data collection throughout the district. Finally, new rules and processes will have to be developed to align with the district’s strategic priorities, its belief in equity, and principals’ autonomy.
Conclusion
Conducting the initiative inventory was the first step in providing the district insight into which programs were working and not working, which students were benefiting, and at what cost. The inventory provided a high-level view of alignment between resources and the strategic plan and the equitable allocation of resources to high-needs student populations. Using the initiative inventory, district leadership can make better decisions about programs and strengthen practices to ensure that all new programs have clear objectives and metrics to assess impact.
Moreover, using this approach demonstrated to the district the power of A-ROI and confirmed to them that this approach could help the district make more informed decisions about resource allocation for the benefit of students. BVSD is now working to adjust their budget process to embed A-ROI concepts. The more data-driven approach to resource allocation will enable the district to achieve its goal to better serve students.
What Is Academic Return on Investment (A-ROI) and Why Is It Important?